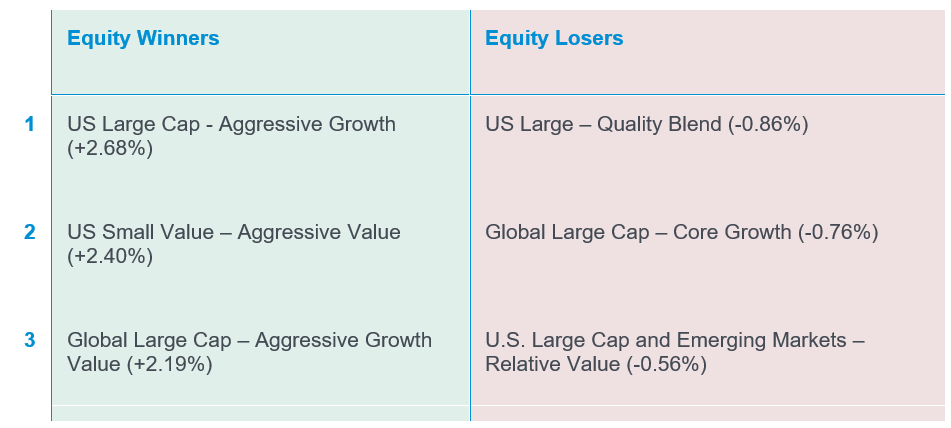
Aapryl Peer Group Manager Skill Performance Matrix
Quarter Ending 3/31/2023
 The performance spread between the top and the bottom quartile within their respective peer groups varied for each Aapryl peer group is shown below. The biggest performance spread between the peer groups top quartile vs bottom quartile occurred in the Global Large Cap Aggressive Growth (+8.22%) growth peer group, with the lowest spread occurred in the Non-US Large Cap High Quality Blend (+1.68%) peer group for the quarter.
Top Quartile vs. Bottom Quartile
Quarter Ending 3/31/2023

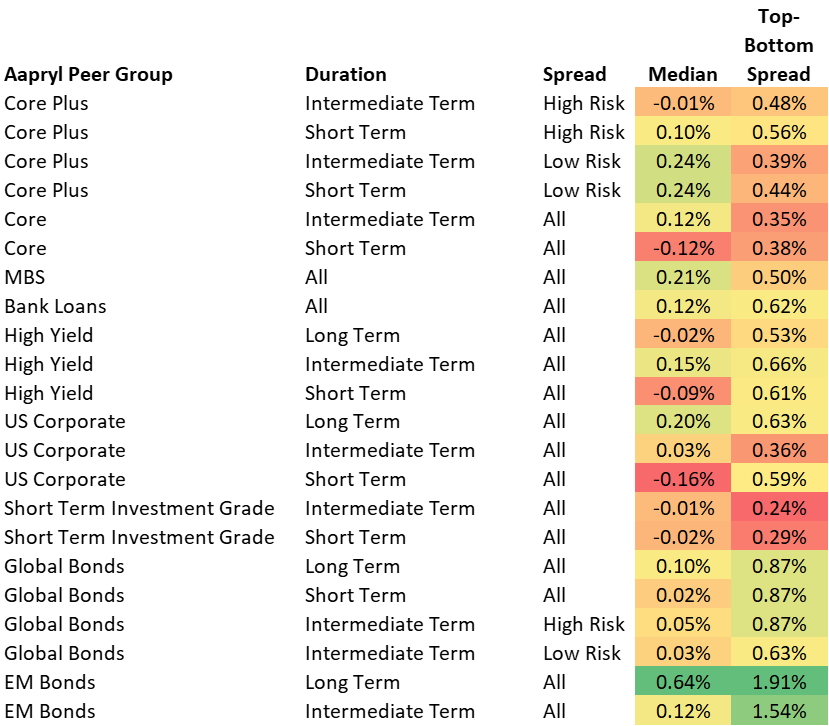
Fixed Income Manager Performance During the Quarter
Active managers in Fixed Income managed to keep up with the market despite the failures of some regional banks. US Corporate Short Term All Spread peer group median performed the worst (-0.16%) with EM Bonds Long Term All Spread peer group median performing the best (+0.64%). Spreads range as high as +1.91% in EM Bonds Long-term Duration All Spread and as low as +0.24% in Short Term Investment Grade Intermediate Term All Spread.


